AI Carbon Tracking · Private by Design
Understand your footprint.
Reshape their future.
Decarbonr turns everyday choices — what you eat, how you travel — into one clear daily number, and shows what the world becomes if everyone lived like you. All on your iPhone. All on-device.
Free trialNo accountNo ads90+ languagesiOS 17.6+
Grounded in peer-reviewed climate science
Poore & Nemecek 2018 · IPCC · Our World in Data · Ecoinvent · European Environment Agency · Carbon Trust
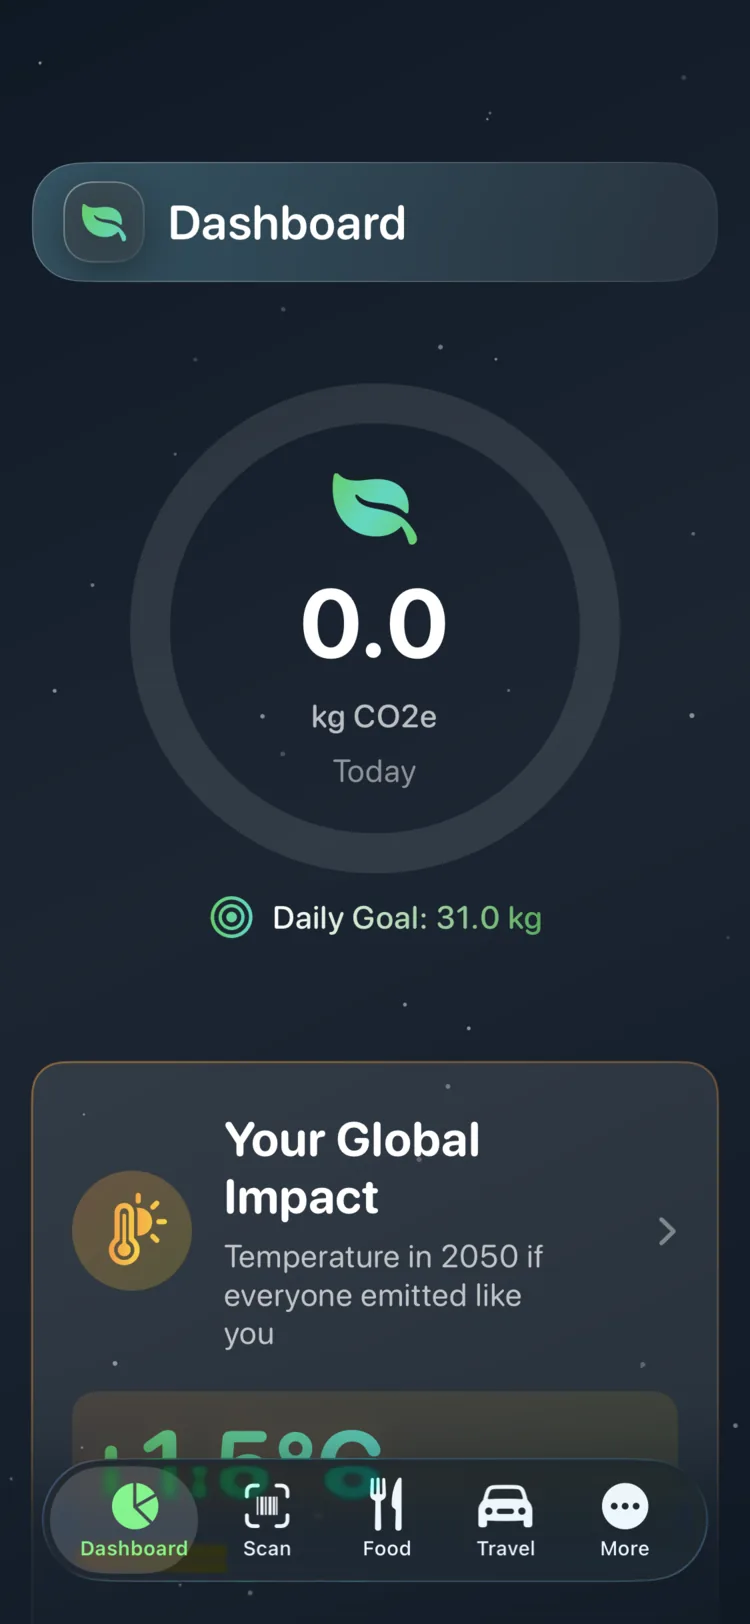
01 / Track your whole life
Every choice, in one number.
Point. Snap. Counted.
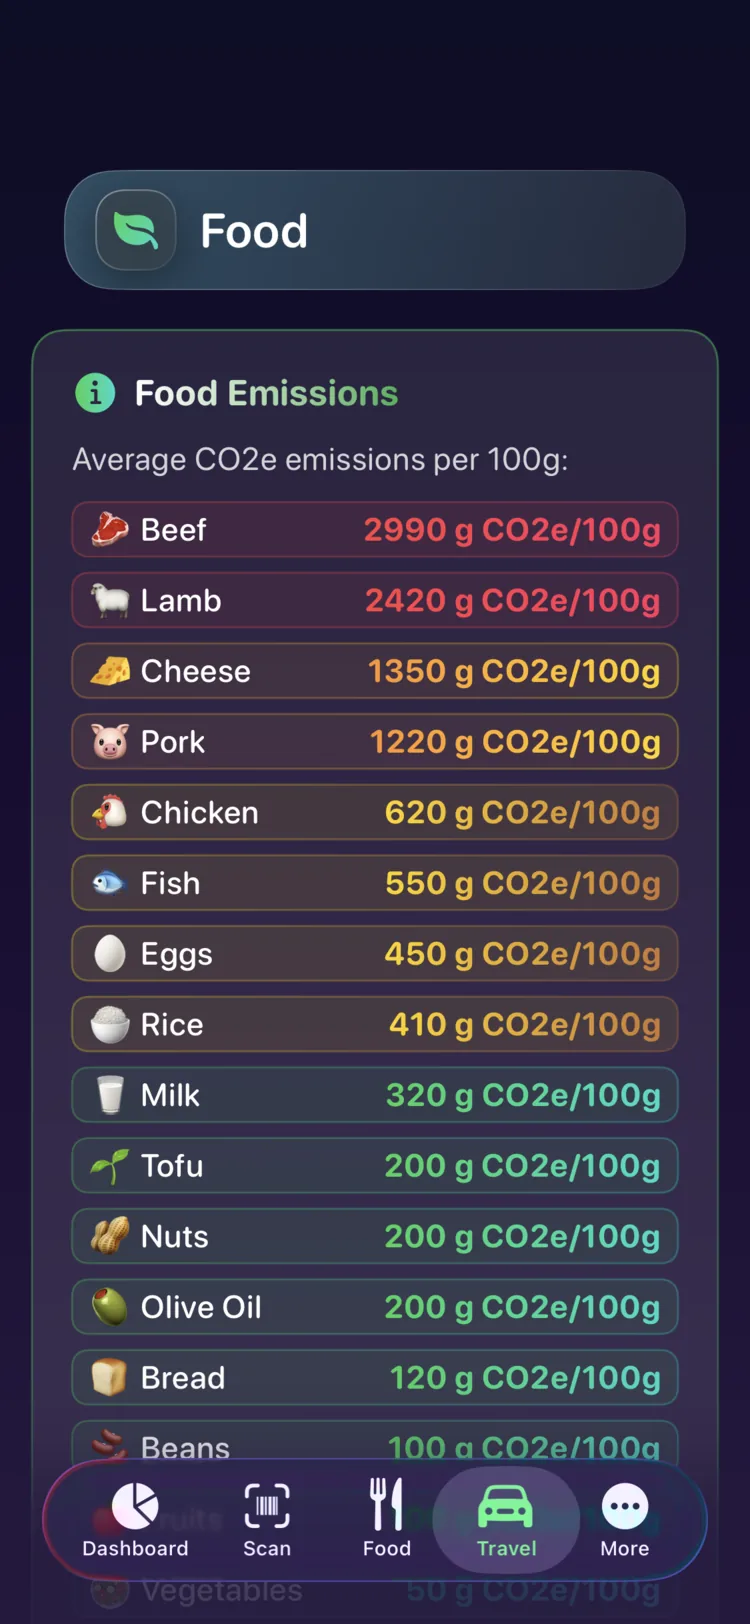
Photograph any meal and the AI scanner (GPT-4 Vision) estimates its footprint ingredient by ingredient. Or scan a barcode to pull data from OpenFoodFacts — the world's largest open food database, 2.9M+ products.
Every trip, measured.
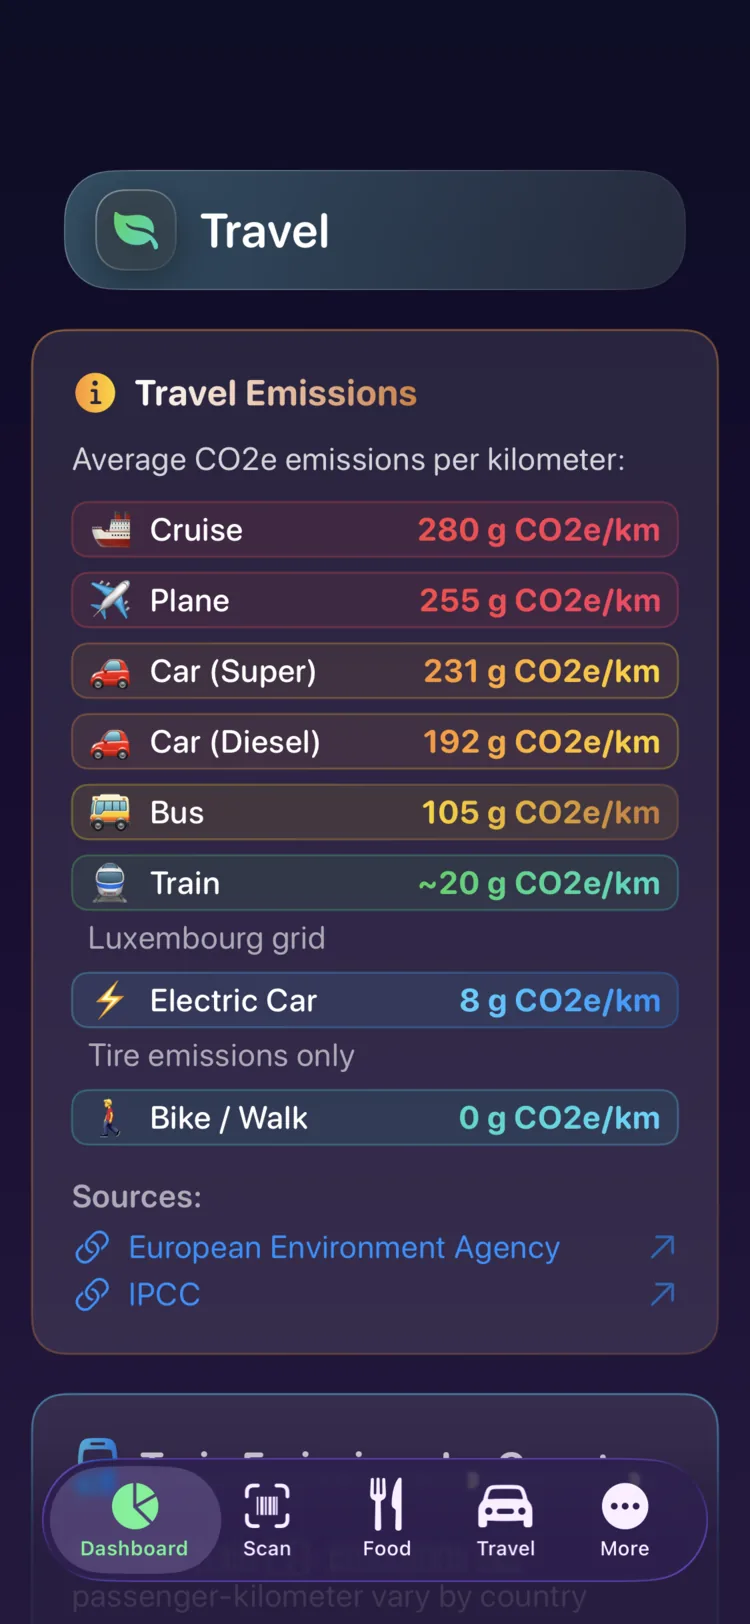
Log journeys across 9 transport modes with real per-kilometer emission factors from the European Environment Agency and IPCC — auto-calculating distances from city pairs.
See where you stand.
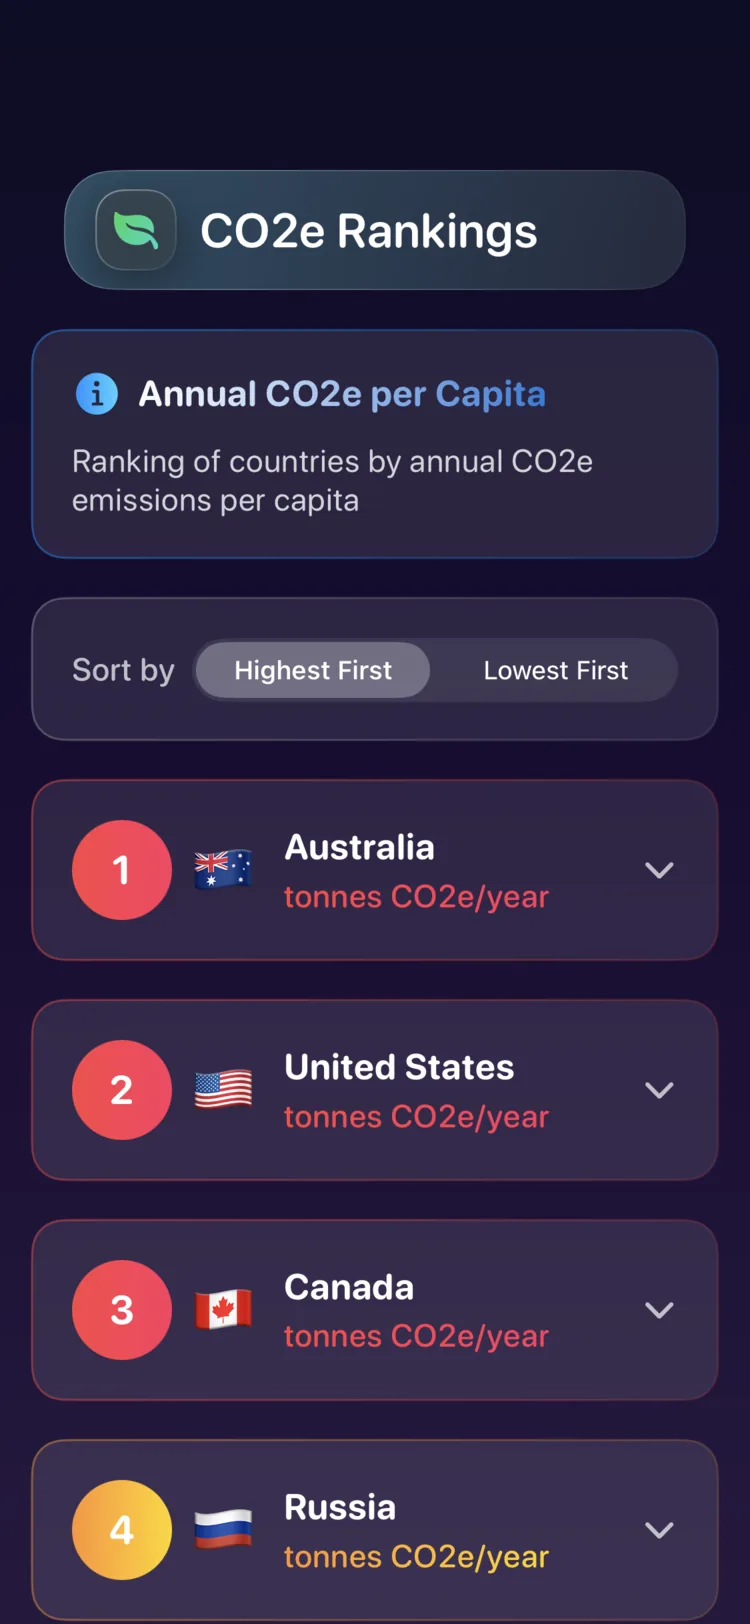
Compare your footprint against national averages worldwide, and track 12+ lifestyle categories — heating, electricity, water, waste, digital, and more — each colour-coded by impact.
products scanned
lifestyle categories
transport modes
languages
02 / The reason it matters
What if everyone lived like you?
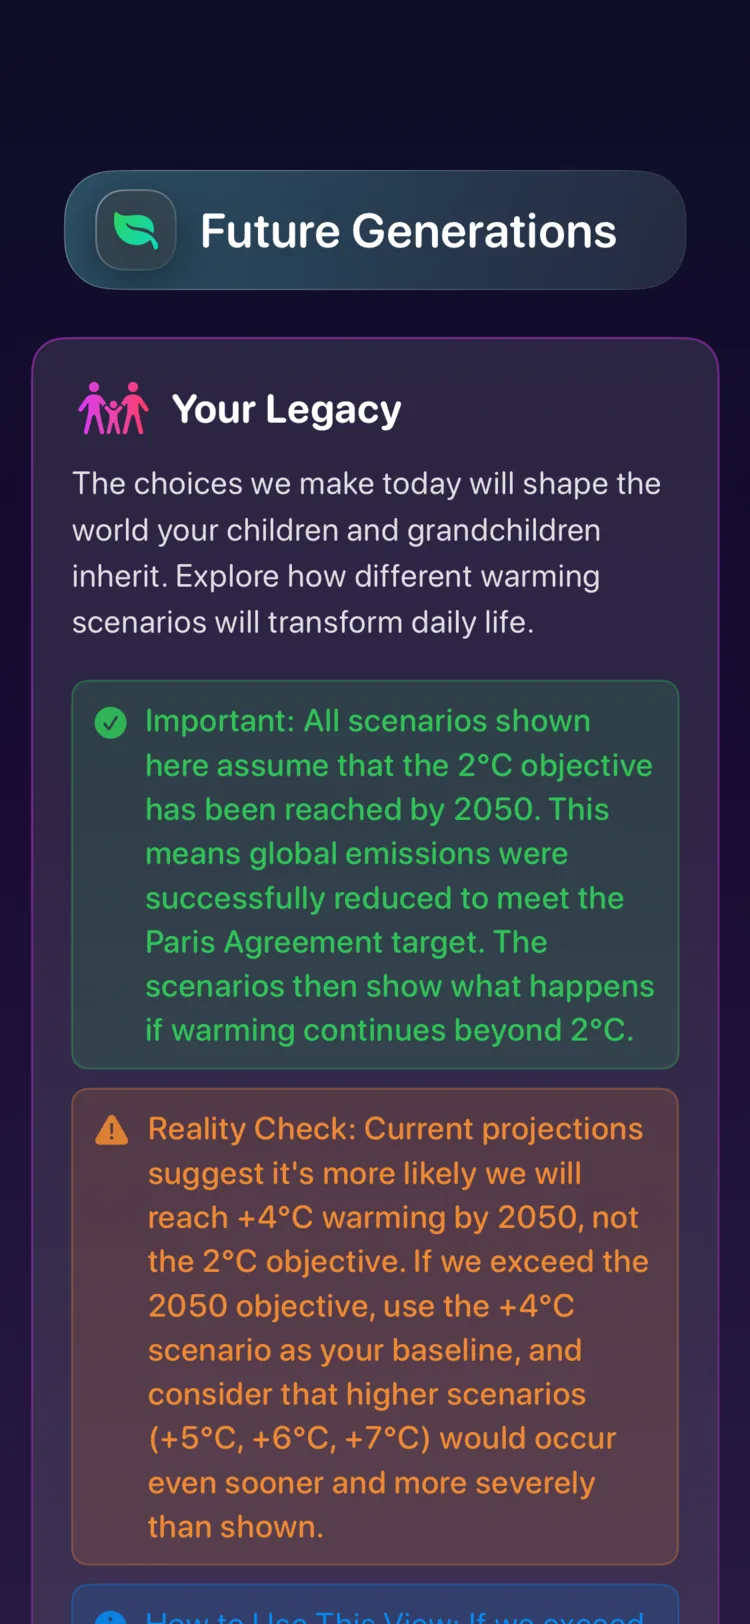
Decarbonr translates your habits into a planet. It shows the temperature the world reaches in 2050 if everyone emitted what you do — and what your choices today mean for the generation that inherits them.
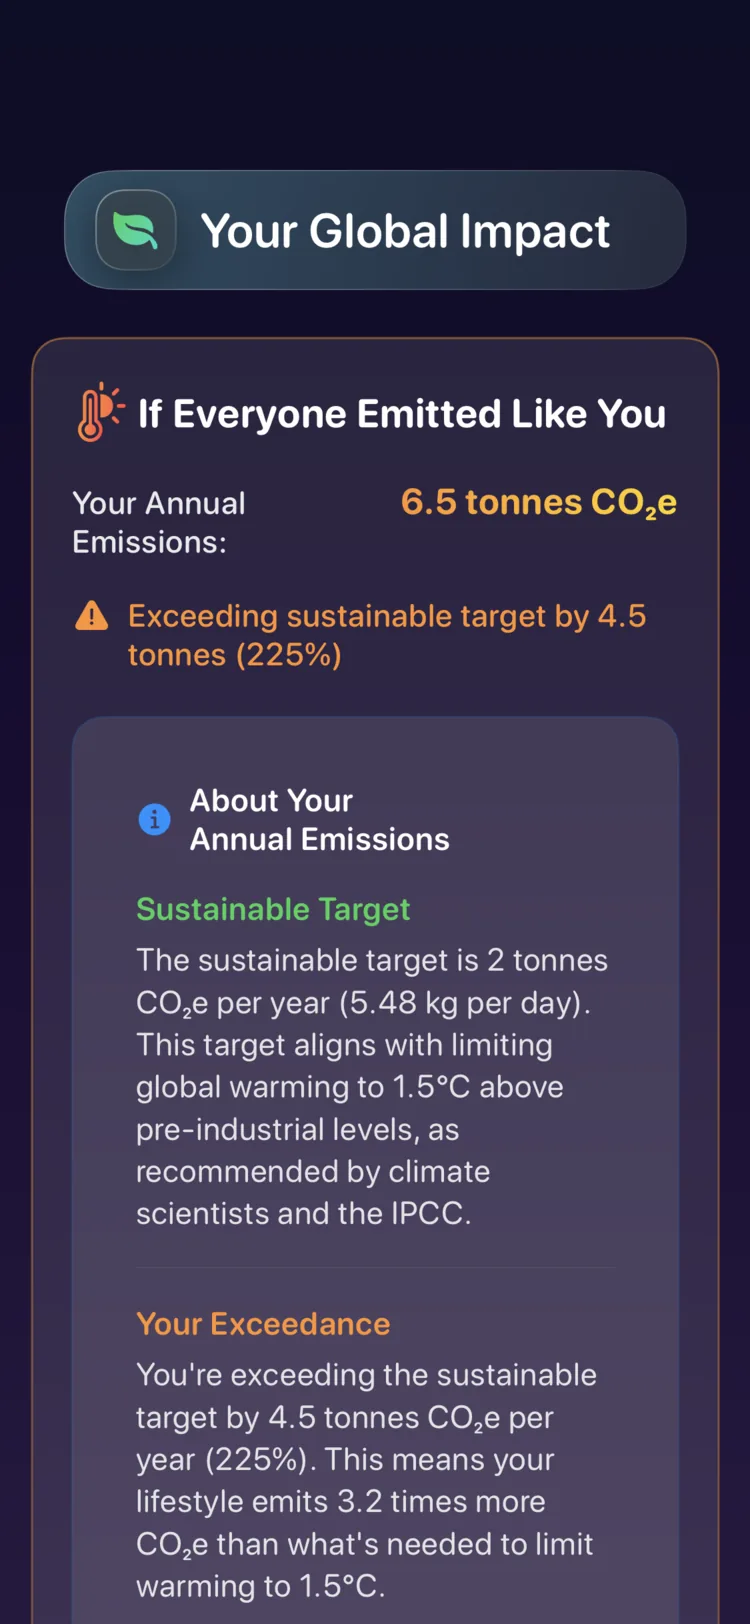
Your annual emissions
6.5 tonnes CO₂e
Exceeding the sustainable target by 4.5 t (225%)
The sustainable target is 2 tonnes/year (≈ 5.48 kg/day) — the level aligned with limiting warming to 1.5°C, per the IPCC.
The choices we make today shape the world our children and grandchildren inherit. Decarbonr makes that link impossible to ignore — and hopeful to act on.
03 / Your 2-tonne goal
Made tangible.
Drag to see your footprint fall. Watch the ring sweep from red, through amber, to emerald as you approach the Paris-aligned 2-tonne target.
04 / Climate, made clear
Learn as you go.
A built-in library of timelines, explainers, carbon calculators, country data, and quizzes — earn eco-points and achievements as you build the habit.
Start with a free trial.
Decarbonr is a subscription with a free trial — no account, no ads, cancel anytime. AI scanning is an optional add-on.
Premium · the app
Free trial, then subscription
weekly · monthly · yearly — save 37% annually
- ✓ Full carbon tracking — food, travel, energy & 12+ lifestyle categories
- ✓ Visual dashboard, country comparisons & temperature impact
- ✓ Personalized, country-specific reduction tips
- ✓ Goals, streaks & achievements
- ✓ Climate education library & quizzes
- ✓ On-device — no account, no ads
AI Features · optional add-on
Supercharge with AI
added on top · weekly · monthly · yearly
- ✓ AI photo meal scanner (GPT-4 Vision) — snap a meal, get its carbon impact
- ✓ Barcode scanner — product carbon data & alternatives
- ✓ Instant CO₂e estimates for scanned items
- ✓ Ingredient-level breakdown with lower-carbon suggestions
Your data never leaves your phone.
Decarbonr is private by design. There's no account to create, nothing synced to a server, and nothing sold. Your footprint is yours alone.
On-device
All data stored locally on your iPhone.
No account
Start tracking instantly — no sign-up.
No tracking
No analytics profiles, no third parties.
No ads
Nothing to distract, nothing to sell.
Start with today.
Free trialNo accountNo ads90+ languagesiOS 17.6+